Certain types of content( e.g., product listings ) are much easier to analyze and compare when the data is presented in rows or within a table. However, many websites use custom designed (HTML)containers which are essentially puffed up “rows” with data points arbitrarily scattered within the container.
Luckily, you can extract information from the page to an orderly list of a comma separated values (CSV), using a little Javascript and some basic web scraping techniques.
Use Case – Example
Full example code on GitHub – DevUnstuck/html-to-csv-demo .
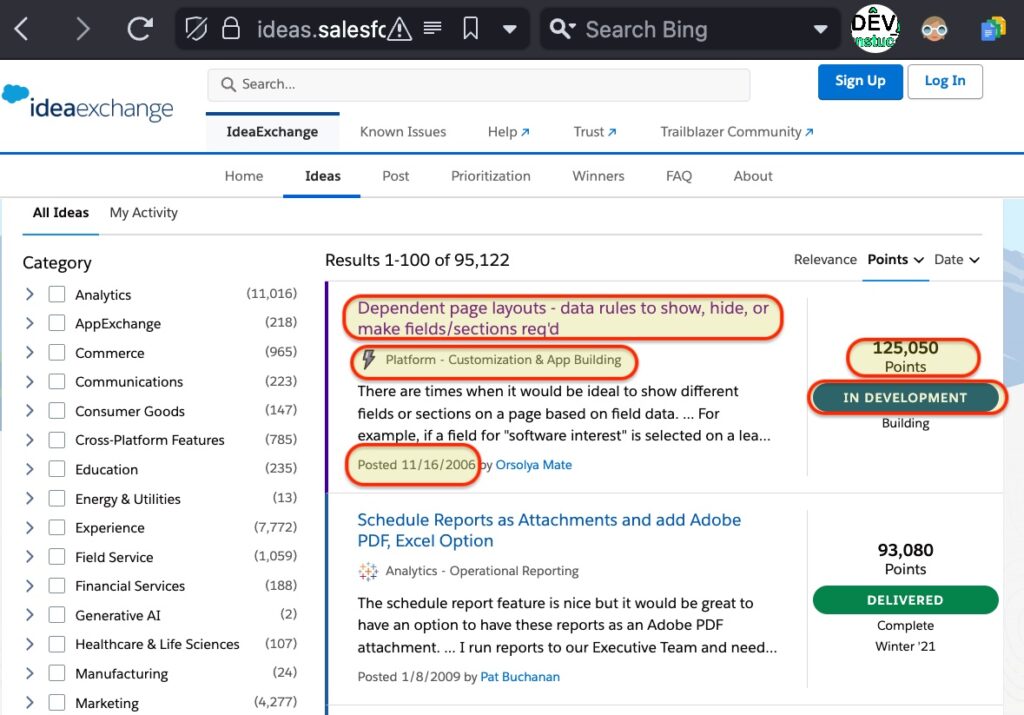
Salesforce’s IdeaExchange platform serves as a good example of this issue. On IdeaExchange, customers and developers can share, discuss, and vote on ideas for new features or improvements to the Salesforce products suite.

I wanted to get a sense of how many issues have not been delivered despite being several years old and having a ton of votes.

But with the current UI, it’s cumbersome to analyze. Even though there are thousands of open ideas, each one is rendered within a stylized panel with the relevant bits of data spread out in a way that resists quick comparison without much scrolling.
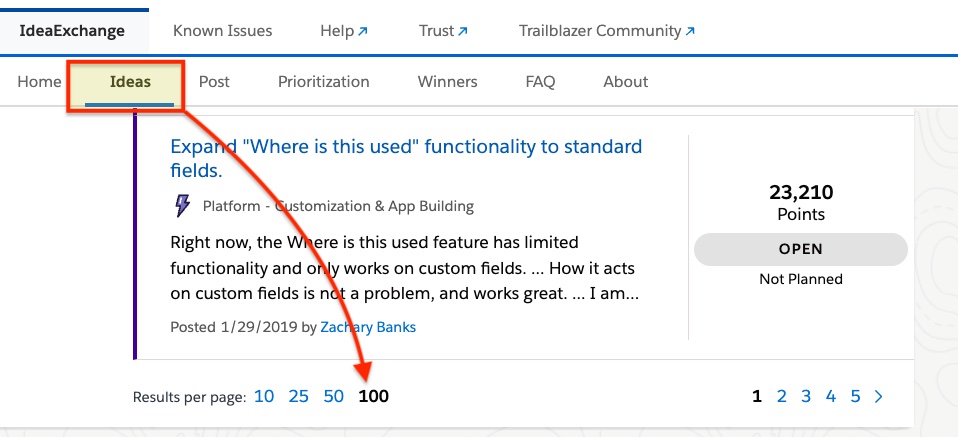
Also, the limit of 100 results max per page makes it hard to visually analyze the data without a lot of scrolling and clicking around.

Let’s fix that!
Solution
Using a Chromium-based browser, open Developer Tools.
Inspect the HTML element which contains the row data, and look for a classname, attribute, or other identifier in common with all the containers. Then, working within the developer tool console tab, use javascript function, document.querySelectorAll to get all the containers.
In the case of IdeaExchange, the container elements are divs with data-cloud-name attribute.
const sfdivs = document.querySelectorAll('[data-cloud-name]');Inspect the HTML for the data points which we want to extract, and look for classnames, attributes or other criteria which can be used to match all instances.
For example, the HTML elements which hold the the number of points/votes all bear the classname coveo-idea-points.
const points = sfdivs[sfdiv]?.querySelector('.coveo-idea-points');
After making note of each data point’s identifier, loop through all the container rows and match each element using the identifiers.
for (const sfdiv in sfdivs) {
...
const points = sfdivs[sfdiv]?.querySelector('.coveo-idea-points');
//Get the other data points.
…
}
Get the text values from all the matched data point elements.
Replace any commas in the content with a “safe” character(e.g. a single empty space), to prevent data being misaligned use .textContent.replaceAll(',', '');
const points = sfdivs[sfdiv]?.querySelector('.coveo-idea-points').textContent.replaceAll(',', '');Finally, in each loop through the container elements, output the text values of the data points. Use commas to separate the data point values.console.info works nicely to print a list in the developer console.
console.info(`${date},${points},${status},${feature},${category}`);
Once the list looks good, Copy and Paste the comma separated values into a text file and save it with the .csv extension.

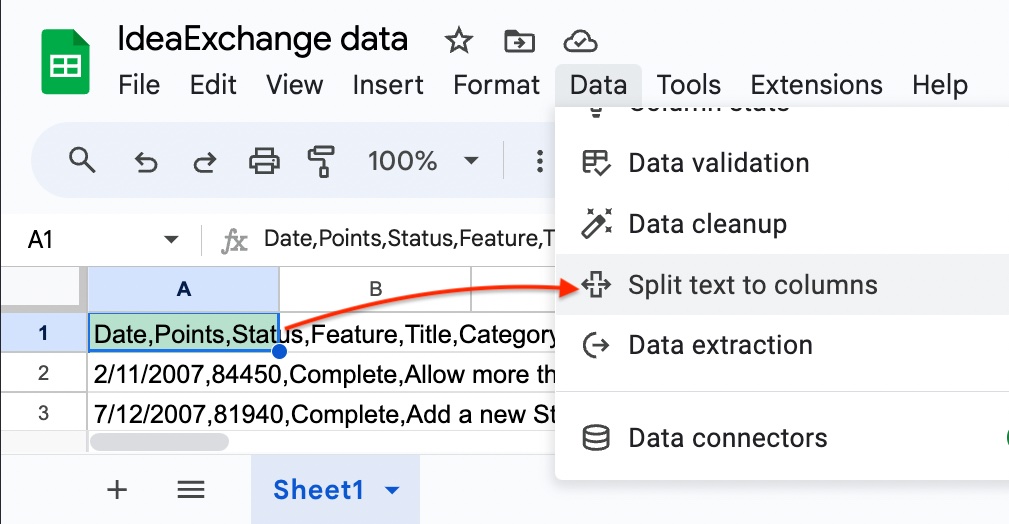
Or paste the results directly into a spreadsheet and split into columns on the commas.

That’s it! Sort and visualize to your heart’s content.📊📈

0 responses to “Extract CSV data from HTML page using Javascript”